| HOME | MENU | DOCS | SEARCH |
Translations of articles in the English language
is in automatic mode, the original version
of the article in Russian - here
The content of the article «Assessment of the cardiovascular system»:
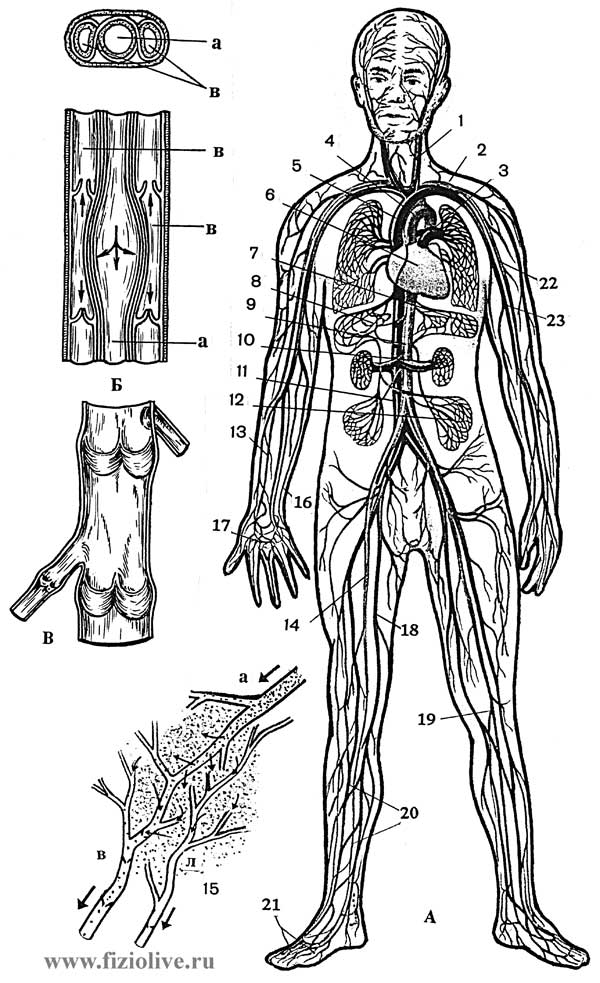
Blood circulation — is one of the most important physiological processes maintaining homeostasis, providing a continuous delivery of all organs and cells of the body necessary for life nutrients and oxygen, removal of carbon dioxide and other metabolic products, processes, immunological protection and humoral regulation of physiological functions (see Fig. Circulatory system).
Circulatory system
Circulatory system: A: 1 — internal jugular vein, 2 — left subclavian artery, 3 — pulmonary artery 4 — aortic arch, 5 — upper hollow Vienna, 6 — heart, 7 — splenic artery, 8 — hepatic artery, 9 — descending aorta, 10 — renal artery, 11 — lower hollow Vienna, 12 — the inferior mesenteric artery, 13 — the radial artery, 14 — femoral artery 15 to the capillary network (a — arterial, venous, l — lymphatic), 16 — cubital vein and artery, 17 — superficial Palmar arch, 18 — femoral vein, 19 — popliteal artery, 20 — artery and vein of leg, 21 — dorsal metatarsal vessels, 22 — brachial artery, 23 — brachial vein; B — cross section of arteries and veins (a — artery, b — vein); In — valves the veins the legs.
Heart rate (HR) depends on many factors, including age, sex, environmental conditions, functional status, body position (see tab. Hemodynamics at rest and during exercise). Higher heart rate in the upright posture compared to the horizontal, decreases with age, subject to daily fluctuations (biorhythms). During sleep it decreases to 3-7 and more, after eating increases, especially if the food is rich in protein, which is associated with increasing blood flow to the abdominal organs. Ambient temperature also affects heart rate, which increases linearly from her.
Hemodynamics at rest and during exercise, depending on body position
| Indicators | Alone | The average load | Maximum load | ||
| lying on your back | standing | lying on your back | standing | standing | |
Cardiac output, l/min |
5,6 | 5,1 | 19,0 | 17,0 | 26,0 |
Heart stroke volume, ml |
30 | 80 | 164 | 151 | 145 |
Heart rate, beats/min |
60 | 65 | 116 | 113 | 185 |
Systolic BP, mm Hg. article |
120 | 130 | 165 | 175 | 215 |
Pulmonary systolic arterial pressure, mm Hg. article |
20 | 13 | 36 | 33 | 50 |
Arteriovenous difference on oxygen, ml/l |
70 | 64 | 92 | 92 | 150 |
Total peripheral resistance, Dyne/sec/cm-5 |
1490 | 1270 | 485 | 555 | 415 |
The work of the left ventricle, kg/min |
6,3 | 7,8 | 29,7 | 27,3 | 47,7 |
Consumption Of2ml/min |
250 | 280 | 1750 | 1850 | 3200 |
Hematocrit |
44 | 44 | 48 | 48 | 52 |
Athletes resting heart rate lower than in untrained people and is 50-55 beats per minute. The sportsmen of extra-class (skiers-racers, cyclists, marathon runners-joggers, etc.) heart rate is 30-35 beats/min. Physical activity increases heart rate, necessary to ensure increasing cardiac output, and there are a number of regularities, which allows to use this indicator as one of the most important when conducting load tests.
There is a linear relationship between heart rate and intensity of work within 50-90% tolerance maximum loads (see Fig. The influence of physical activity on heart rate), but there are individual differences associated with gender, age, physical readiness of the patient, environmental conditions, etc.
The influence of physical activity on heart rate
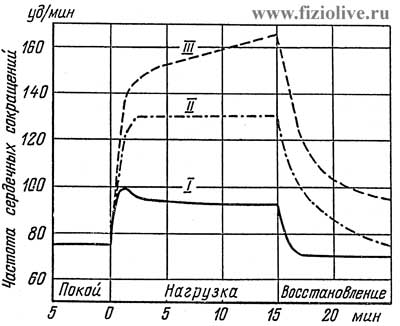
I — light duty; II — medium; III — heavy load (L. Brouda, 1960)
In mild exercise heart rate first significantly increases and then gradually decreases to a level that is maintained throughout the period of stable operation. When more intense and sustained loads tends to increase heart rate, and maximum work when she grows up is extremely achievable. This value depends on fitness, age, gender of the patient and other factors. In 20 years the maximum heart rate is about 200 beats/min to 64 years drops to approximately 160 beats/min due to General age-related decline in biological functions of humans. Heart rate increases in proportion to the amount of muscular work. Normally, when a load rate of 1000 kg/min heart rate reaches 160 to 170 beats/min, as the load increases heart rate accelerate more moderately, and gradually reach maximum values of 170-200 beats/min. Further increase in strain is accompanied by an increase in heart rate.
It should be noted that the work of the heart at a very large rate becomes less effective, as it significantly reduces the time of filling the ventricles with blood, and decreases stroke volume.
Tests with increasing loads until reaching the maximum heart rate lead to exhaustion, and in practice used only in sports and space medicine.
On the recommendation of who is considered to be permissible load, in which the heart rate reaches 170 beats/min and at this level usually stops in determining the exercise capacity and functional status of the cardiovascular and respiratory systems.
The liquid flowing through the vessel, has on its wall a pressure, usually measured in millimeters of mercury (Torr) and less frequently in dyn/cm Pressure equal to 110 mm Hg. article, means that if the vessel was connected with a mercury manometer, the pressure of fluid on the end of the vessel would divert the column of mercury to a height of 110 mm. When using water pressure gauge move the column would be about 13 times more. The pressure of 1 mm Hg. art — 1330 Dyne/cm2. Pressure and blood flow in the lungs vary with the position of the human body.
There is a pressure gradient directed from arteries to arterioles and capillaries from peripheral to Central veins (see Fig. The average pressure in various areas of the vascular bed). So blood pressure decreases in the following direction: aorta — arterioles — capillaries — venules — large veins — Vena cava. Due to this gradient the blood flows from heart to arterioles, then to capillaries, to venules, to veins and back to the heart. The maximum pressure developed at the time of ejection of blood from the heart into the aorta, called the systolic (SD). When, after the ejection of blood from the aortic heart valves close, the pressure falls to a value corresponding to the so-called diastolic pressure (DD). The difference between systolic and diastolic pressure is called pulse pressure. The average pressure (CP. D) can be determined by measuring the area bounded by a curve of pressure, and dividing it by the length of this curve.
The average pressure in various areas of the vascular bed
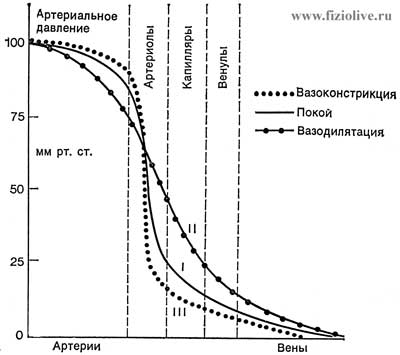
At rest (I), during expansion (II) narrowing and (III) vessels. In the large veins located near the heart (Vena cava), the pressure during the breath may be slightly below atmospheric (C. A. Keele, E. Neil, 1971)
CP. D = (area under curve) / (length of curve)
Fluctuations in blood pressure due to the pulsating nature of blood flow and high elasticity and extensibility of blood vessels. Unlike changeable systolic and diastolic pressure mean pressure is relatively constant. In most cases, it can be considered equal to the sum of diastolic pressure and 1/3 pulse (B. Falcam, E. Neal, 1976):
Pcp. = Pdist. + [(РSyst. — Pdist.) / 3]
The speed of propagation of the pulse wave depends on the size and elasticity of the vessel. It is in the aorta is 3-5 m/s, in medium-sized arteries (subclavian and femoral) — 7-9 m/sec in small arteries of the extremities — 15-40 m/s.
Blood pressure depends on several factors: the amount and viscosity of blood flowing in the vascular system per unit time, the capacity of the vascular system, the intensity of the outflow through the precapillary direction, the tension of the walls of the arteries, physical activity, environment, etc.
In the study of AD is of interest the measurement of the following indicators: the minimum arterial pressure medium dynamic, and maximum shock pulse.
Under the minimum or diastolic pressure understand the lowest value which reaches the blood pressure by the end of the diastolic period.
The minimum pressure depends on the permeability or the amount of blood flow through the system precapillaries, heart rate and viscoelastic properties of the arterial vessels.
The average dynamic pressure — is the average pressure that can, in the absence of pulse pressure variations to produce the same hemodynamic effect which is observed under natural, fluctuating blood pressure, that is, the average pressure energy expresses the continuous motion of blood. The average dynamic pressure is determined by the following formulas:
1. The Hickam Formula:
Рm = A/3 + Pd
where Рm — is the mean dynamic arterial pressure (mm mercury); А — pulse pressure (mm mercury); Рd — is the minimum or diastolic blood pressure (mm mercury)
2. Formula Wetzler and Roger:
Pm = 0,42Рs + 0,58Рd
where Рs — is the systolic, or maximum pressure, Рd — diastolic or minimal blood pressure (mm mercury).
3. Fairly common formula:
Рm = 0,42А + Рd
where А — is pulse pressure; Рd — diastolic pressure (mm mercury).
The maximum, or systolic pressure — a value reflecting the entire stock of potential and kinetic energy possessed by moving mass of blood in this area of the vascular system. The maximum lateral pressure is composed of systolic blood pressure and shock (hemodynamic shock). Systolic lateral pressure acts on the side wall of the artery during systole of the ventricles. Hemodynamic shock is created when the sudden appearance of obstacles in front of a moving vessel in the blood flow, the kinetic energy for a short time turns into pressure. Hemodynamic impact is the result of inertial forces, defined as the increase in pressure in each pulsation, when the vessel is compressed. The magnitude of hemodynamic stroke in healthy people is equal to 10-20 mm. mercury.
The true pulse pressure represents the difference between the lateral and the minimum blood pressure.
For measuring blood pressure use sphygmomanometer Riva-Rocci and stethoscope.
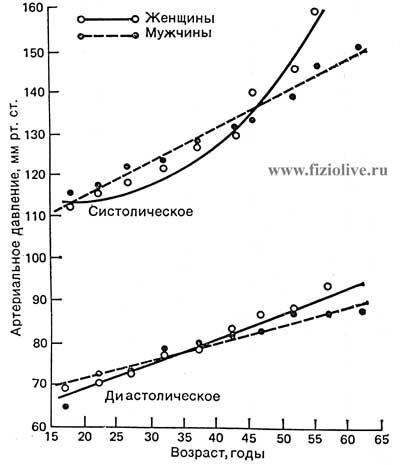
In Fig. Systolic and diastolic blood pressure the values of blood pressure in healthy people aged 15 to 60 years of age and older. With age in men systolic and diastolic blood pressure grow evenly, women the pressure dependence of the harder age: from 20 to 40 years, the pressure in them increases slightly, and its magnitude is smaller than in men; after age 40 with the onset of menopause, the pressure to quickly increase and become higher than that of men.
Systolic and diastolic blood pressure depending on age and gender
The obese AD higher than in people with normal body weight.
During exercise systolic and diastolic AD, cardiac output and heart rate increase, as well as when walking at a moderate pace AD increases.
When Smoking systolic blood pressure may increase by 10-20 mm mercury. At rest and during sleep, the AD is significantly reduced, especially if it was elevated.
Blood pressure rises in athletes before the start, sometimes after just a few days before the competition.
On blood pressure is mainly affected by three factors: a) heart rate (HR); b) change in peripheral resistance of the vascular bed and b) the change in stroke volume or cardiac output blood.
In the human heart there is a specialized, anatomically distinct conducting system. It consists of the sinoatrial and atrioventricular nodes, beams of GIS with his left and right legs, and Purkyne fibres. This system is composed of specialized muscle cells that has the property of automaticity and high speed transfer of excitation.
The spread of the electrical impulse (the action potential) conduction system and the muscle of the Atria and ventricles is accompanied by a depolarization and repolarization. Recorded as a result of this wave, or teeth, are called waves of depolarization (QRS) and repolarization (T) of the ventricles.
ECG — is a recording of the electrical activity (depolarization and repolarization) of the heart, registered with the help of electrocardiograph electrodes which (leads) are placed not directly on the heart, and the different parts of the body (see Fig. The scheme of electrodes of the ECG).
The scheme of electrodes ECG

The scheme of electrodes at standard (a) and thoracic (b) leads of the electrocardiogram and ECG obtained with these leads
The electrodes may be located at different distances from the heart, including on the limbs and chest (they are indicated by the symbol V).
Standard leads from extremities: the first (I), abduction (right hand LEVEL, left hand LR); the second (II) the allotment (PR and left leg — LF) and third (III) abstraction (LR—LD) (see Fig. The scheme of electrodes of the ECG).
Chest leads. To record ECG active electrode is applied on different points of the thorax (see Fig. The scheme of electrodes EKG), denoted by the numbers (V1, V2, V3, V4, V5, V6). These derivations reflect the electrical processes in a more or less localized areas and help to identify a number of heart disease.
The teeth and intervals of the electrocardiogram (ECG) In Fig. Diagram of a normal electrocardiogram the normal electrocardiogram shows a typical man in one of the standard leads, the duration and the amplitude of teeth are given in table. The teeth of the normal electrocardiogram (ECG) of a person. A the P wave corresponds to depolarization of Atria, QRS complex — the beginning of depolarization of ventricles, T wave — repolarization of the ventricles. The U prong is usually absent.
Diagram of a normal electrocardiogram

пп — excitation of the right atrium; лп — excitation of the left atrium
The teeth of the normal electrocardiogram (ECG) of a person
| Designation of teeth | Characteristics of teeth | The range of duration, with | The range of amplitudes in I, II and III lead, mm |
| P | Reflects depolarization (excitation) of both Atria, normal prong positive |
0,07 - 0,11 | 0,5 - 2,0 |
| Q | Reflects the beginning of ventricular depolarization, the negative prong (pointing down) |
0,03 | 0,36 - 0,61 |
| R | The main prong of depolarization of the ventricles, positive (pointing up) |
see QRS | 5,5 - 11,5 |
| S | Represents the end of depolarization of both ventricles, the negative prong |
- | 1,5 - 1,7 |
| QRS | A set of teeth (Q, R, S), reflecting the depolarization of the ventricles |
0,06 - 0,10 | 0-3 |
| T | Reflects the repolarization (extinction) of their ventricular; prong positive in I, II, III, aVL, aVF and negative in aVR |
0,12 - 0,28 | 1,2 - 3,0 |
In the analysis of ECG is of great importance are the time intervals between some of the teeth (see tab. The intervals of the electrocardiogram). Deviation of the duration of these intervals for the normal range may indicate dysfunction of the heart.
The intervals of the electrocardiogram
| The symbol interval | Feature intervals | Duration, with |
| P-Q | From the beginning of the atrial excitation (P) to the beginning of ventricular excitation (Q) |
0,12 - 0,20 |
| P-R | From beginning of P to beginning of R |
0,18 - 0,20 |
| Q-T (QRST) | From the beginning of Q to end of T; corresponds deposi - tion and repolarization of ventricles (electrical systole) |
0,38 - 0,55 |
| S-T | From end of S to beginning of T, reflects the phase of full depot - spp polarization of the ventricles. In the norm of the deviation (offset) from the contour should not exceed 1 mm |
0-0,15 |
| R-R | The duration of the cardiac cycle (a full cycle of the heart). Normally, these segments have almost the same length |
|
| T-P | Reflects the resting state of the myocardium (electrical diastole). This segment should be taken at the level of the isoelectric line in norm and pathology |
There are two main types of pathological changes in ECG: the first are the rhythm disturbances and the occurrence of excitation, the second — disorders of excitation and distortion of the shape and configuration of teeth.
Arrhythmias or rhythm disturbances of the heart, characterized by irregular flow of impulses from the sinoatrial (SA) node.
The rhythm (frequency of contractions) of the heart may be low (bradycardia) or very high (tachycardia) (see Fig. ECG in cardiac arrhythmias). Atrial extrasystoles are characterized by a shortened R-R interval followed by a long R-R interval (see Fig. ECG if arrhythmia, А). With ventricular extrasystoles, when excitation occurs in ectopic foci, localized in the wall of the ventricular premature contraction is characterized by distorted QRS complex (see Fig. ECG if arrhythmia, В). Ventricular tachycardia is accompanied by a fast regular discharge of ectopic foci located in the ventricles (see Fig. ECG if arrhythmia, D). Atrial fibrillation or ventricular arrhythmic characterized by irregular contractions that are ineffective in hemodynamic terms. Atrial fibrillation manifested by the irregular arrhythmic contractions, in which the rate of fibrillation in 2-5 times greater than in the ventricles (see Fig. ECG in cardiac arrhythmias, Е). At each R-wave represents 1, 2 or 3 irregular wave Р.
With atrial flutter, there are more regular and less frequent atrial complexes, the frequency of which is still 2-3 times higher than the frequency of contractions of the ventricles (see Fig. ECG in cardiac arrhythmias, Ж). Atrial fibrillation can be caused by multiple ectopic foci in their walls, while the discharges of single ectopic foci accompanied by atrial flutter.
ECG if arrhythmia

ECG in cardiac arrhythmias: А — atrial contraction; Б — node contraction; В — ventricular contraction; Г — atrial tachycardia; Д — ventricular tachycardia; Е — atrial fibrillation; Ж — atrial flutter
Ischemic heart disease, myocarditis, coronarocardiosclerosis and other diseases occur due to impaired blood supply to the myocardium.
In Fig. ECG in violation of the coronary circulation are changes in QRS complex in myocardial infarction. In the acute stage there are marked changes of teeth Q and T and segment T. It should be noted, in particular, ST-segment elevation and inverted T wave in some leads. Primarily occurs myocardial ischemia (disruption of blood supply, pain attack), damage the tissue with the subsequent formation of necrosis (the deadening) myocardial area. Poor circulation in the heart muscle are accompanied by changes of conductivity, arrhythmia.
ECG in violation of the coronary circulation
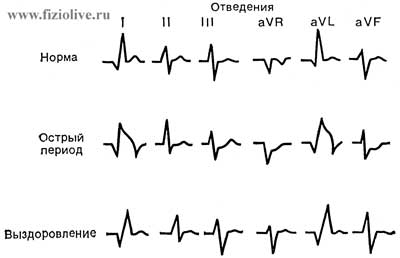
ECG changes in dynamics in the violation of the coronary circulation (myocardial infarction). When fresh heart attack in some derivations there is a pathological tooth Q, negative T wave and the upward displacement of the segment S-T in a few weeks nearly restored the ECG to normal
In sports medicine ECG recorded directly during the execution of the dosed physical load.
For full specifications of the electrical activity of the heart at all stages of loading ECG is recorded during the first minutes of work, and then in the middle and the end (when testing on a treadmill, a Bicycle Ergometer or Harvard step test, waterway, etc.).
For athletes features the following ECG:
— sinus bradycardia,
— smoothed the P wave (cyclic sports),
— increase the voltage of QRS complex (associated with hypertrophy of the left ventricle) (see Fig. Electrocardiogram in left ventricular hypertrophy),
— incomplete blockade of the right leg of the Daes (slow conduction).
Electrocardiogram in left ventricular hypertrophy
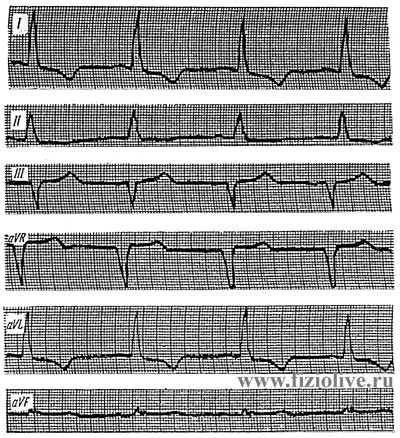
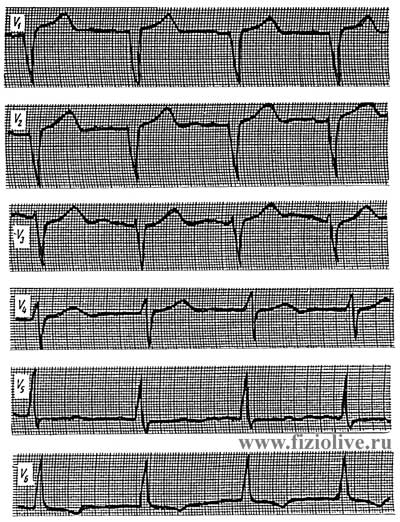
Electrocardiogram in left ventricular hypertrophy: QRS = 0,09 с; tooth QI, V4—V6 is not defined; RI high; > RII > rIII < SIII (< a = -5°); SV1—V3 deep zone, a transition zone is displaced to the left; RV5,V6 high, RV6 > RV5; SV1-V3 + RV6 > 35 mm; PS-TI,II,aVL,V5,V6 below the contour; TI,aVL,V6 negative; TV1,aVR positive
In well-trained athletes when carrying moderate loads usually increase the teeth R, R, and T, are shortened segments PQ, QRS and QRST.
If the loads exceed the level of preparedness of the athlete, in heart muscle have a poor circulation and the adverse biochemical changes that manifest themselves as ECG rhythm disturbance or conduction and ST-segment depression. Causes of lesions of the heart is hypoxemia and tissue hypoxia, coronary spasm blood vessels and atherosclerosis.
Athletes meet dystrophy infarction, acute heart failure, hemorrhage in the heart muscle, metabolic necrosis in the myocardium. Dystrophy on the ECG showed flattening of T waves, P, lengthening the interval P-Q and Q-T. In case of strain of the right ventricle on the ECG in V1,2 lead appears incomplete or complete blockage of the right branch of the bundle of Daes increases the amplitude of the R wave decreases prong S, a negative T wave and segment C moves lower contours, arrhythmia (prolonged PQ interval).
For more detail see article Assessment of physical development
V.I. Dubrovsky,
Academician of the Russian Academy of Natural Sciences,
IANPO and the New York Academy of Sciences,
Doctor of Medical Sciences, Professor,
A.V. Dubrovskaya, pediatrician
It is available for the original version
of the article in Russian
<< Previous: sports, featured articles

We recommend that you look at the popular sections of the site myvaleology.com: MENU with a description of the sections | |||
| SOCIAL | DONATION | MY DIET | MY SPORT |

|
Release all4e8 |
||
Copyright © VZOJ 2023. All rights reserved. When reprinting or quoting myvaleology.com materials please put a link to the site myvaleology.com :
<a href="https://myvaleology.com">Healthy lifestyle</a>